
Understanding the Inverted Yield Curve and what it tells us
Understanding the Inverted Yield Curve
In the world of finance, few indicators carry as much weight and intrigue as the yield curve. It’s a graph that plots the interest rates of bonds with similar credit quality but different maturity dates. Among its various shapes and forms, the inverted yield curve stands out as both an enigma and a harbinger of economic shifts. In this article, we’ll look into what exactly an inverted yield curve is, using the 10-year versus 3-month Treasury yield as an example, and explore its significance for the financial markets.
What is an Inverted Yield Curve?
Traditionally, the yield curve slopes upward, indicating that longer-term bonds have higher yields compared to shorter-term ones. This makes intuitive sense; investors generally demand higher returns for locking their money away for extended periods due to the increased risk and uncertainty associated with longer time horizons.
Conversely, an inverted yield curve occurs when shorter-term bonds yield more than longer-term ones. In other words, it’s a scenario where the yield curve flips, resembling a downward slope. This inversion often grabs headlines and sends ripples through financial markets due to its historical association with economic downturns.
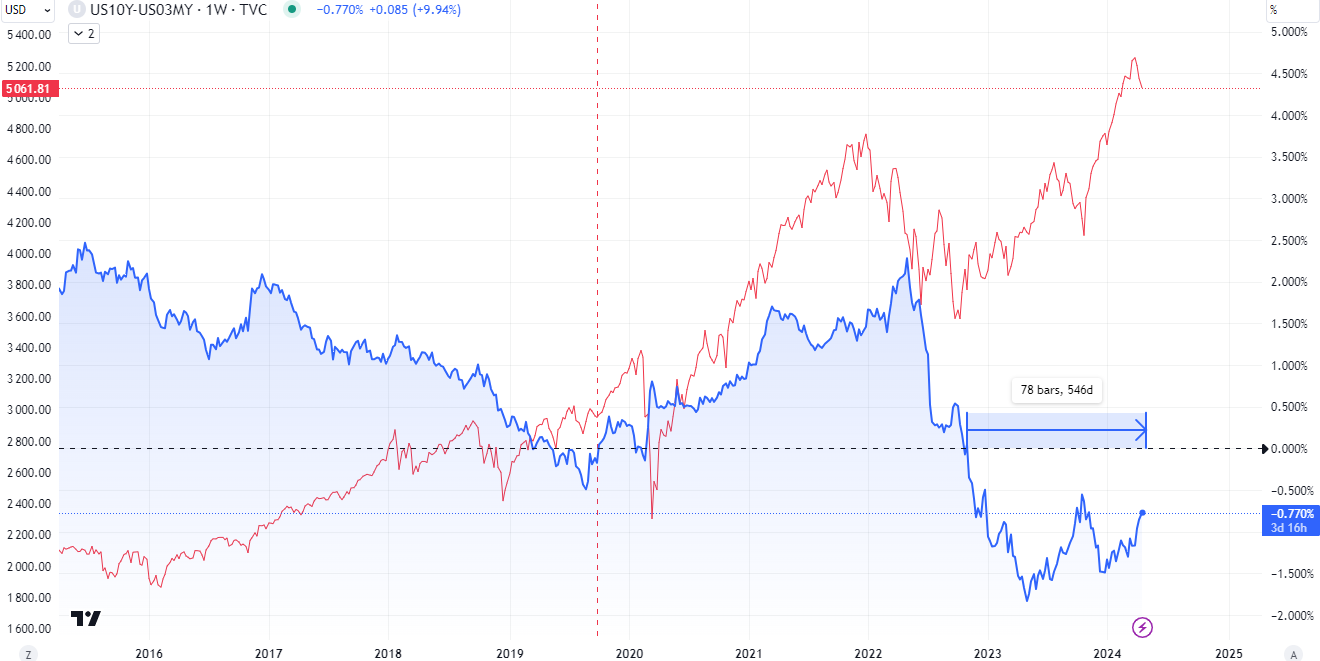
For our example, let’s consider the 10-year versus 3-month Treasury yield (see below chart, blue line – Red Line is the SP500). When the yield on the 3-month Treasury bill surpasses that of the 10-year Treasury note, the curve inverts. This means the curve goes below zero. This specific pairing is closely monitored by investors and economists alike for its predictive power regarding future economic conditions.

Signaling Market Trends
The inversion of the yield curve, particularly the 10-year versus 3-month spread, has historically foreshadowed economic slowdowns and, in some cases, recessions. This phenomenon occurs because investors start demanding higher returns on short-term investments, reflecting their pessimism about the near-term economic outlook. It is considered as one of the rare forward-looking (predictive) indicators.
Several factors contribute to this pessimism. One primary reason is the anticipation of central banks cutting interest rates to stimulate the economy. When investors believe that short-term rates will fall due to monetary policy actions aimed at boosting economic activity, they rush to buy short-term bonds, driving down their yields. This increased demand for short-term bonds coupled with lower yields creates an inverted yield curve.
Furthermore, an inverted yield curve can signal tight monetary conditions. Central banks often raise short-term interest rates to curb inflation or cool down an overheating economy (as it is the case in 2023 / 2024). This tightening of monetary policy can lead to higher short-term yields, contributing to the inversion.
Additionally, investors’ flight to safety plays a role. When economic uncertainty mounts, investors seek refuge in longer-term bonds, driving their yields lower. This flight to safety, combined with expectations of lower short-term rates, reinforces the inversion.
Market Reaction and Policy Implications
The inversion of the yield curve typically triggers anxiety among investors and policymakers. It’s viewed as a warning sign that economic growth may falter in the coming months or years. As a result, financial markets often react negatively to an inverted yield curve, with stock prices falling and bond yields declining. However, what is very hard to determine is when this can happen. Inversions can last for months, and their consequences can also take a lot of time to materialize.
For policymakers, an inverted yield curve presents a conundrum. Central banks may interpret it as a signal to ease monetary policy by cutting interest rates to stimulate borrowing and investment. However, navigating the delicate balance between supporting economic growth and guarding against inflationary pressures poses a significant challenge.
Moreover, an inverted yield curve can influence consumer and business behavior. Heightened economic uncertainty may prompt consumers to reduce spending, while businesses may scale back investment plans in anticipation of weaker demand.
Where is the yield curve today?
The chart below illustrates the 10-year versus 3-month treasury yield curve in blue, with the red line representing the US stock market. Due to short-term interest rates paying more than long-term ones, the curve is inverted (below zero). It has now been inverted for 546 days since October 2022.
Despite the inversion, the US stock market (red line) has rallied to new all-time highs. However, if we look at the previous inversion that occurred in 2019, it took 140 days for the inversion to close (go above zero) and another 140 days for the market to correct. If we assume history could repeat itself, we should then wait for the current inversion to close and then wait four or five months for the market to correct.
Unfortunately, things are not that simple. Another notable difference between the 2019 inversion and the current one is the duration and depth of the inversion. The current inversion is much more significant and has been inverted for four times longer and is still not closed. Historically, longer and deeper inversions have resulted in longer and deeper market corrections.
Does this mean the market is doomed?
The inverted yield curve serves as a crucial barometer of economic health and investor sentiment. While it doesn’t guarantee an imminent recession, its historical accuracy in predicting economic downturns underscores its importance for market participants and policymakers alike. Understanding the nuances of the yield curve and its various signals can empower investors to navigate uncertain economic landscapes with increased confidence.
Important Disclaimer:
The content of this article or any content from CryptoCollege.cc is for educational purposes only. It is not investment advice. Therefore, investors must do their due diligence before making any type of investment decision. Read more here.
CC Learn and Earn Bitcoin Program:
We give part of our YouTube advertising revenues in Bitcoin (Sats) to our community. To participate, subscribe to our YouTube Channel and complete the educational challenges we launch on our various Social Media @CryptoCollegeCC . Read more about the CryptoCollege.cc Learn and Earn Program here.
Support and Donations:
If you find our content useful and want to support us. You can either follow us on Social Medias @CryptoCollegeCC or donate to the below addresses. Thank you for your support!
Bitcoin: bc1q85ngl882te4rqery2028auha8dsxlsu89aqjxqle0n6zkuqg5a6q3m38t5
Ethereum or ERC20 Token: 0xc873fBcB5DB38B87CaC2e02C28A5C504eC673d62


Tag:Economy, Markets, Yield Curve
You may also like

The Libra Scandal in Argentina and President Milei’s Involvement

What is Fractional Banking and how it impacts you
